For multi-state operators, investors and lenders
Underwrite Medicaid rate exposure across every state in a footprint.
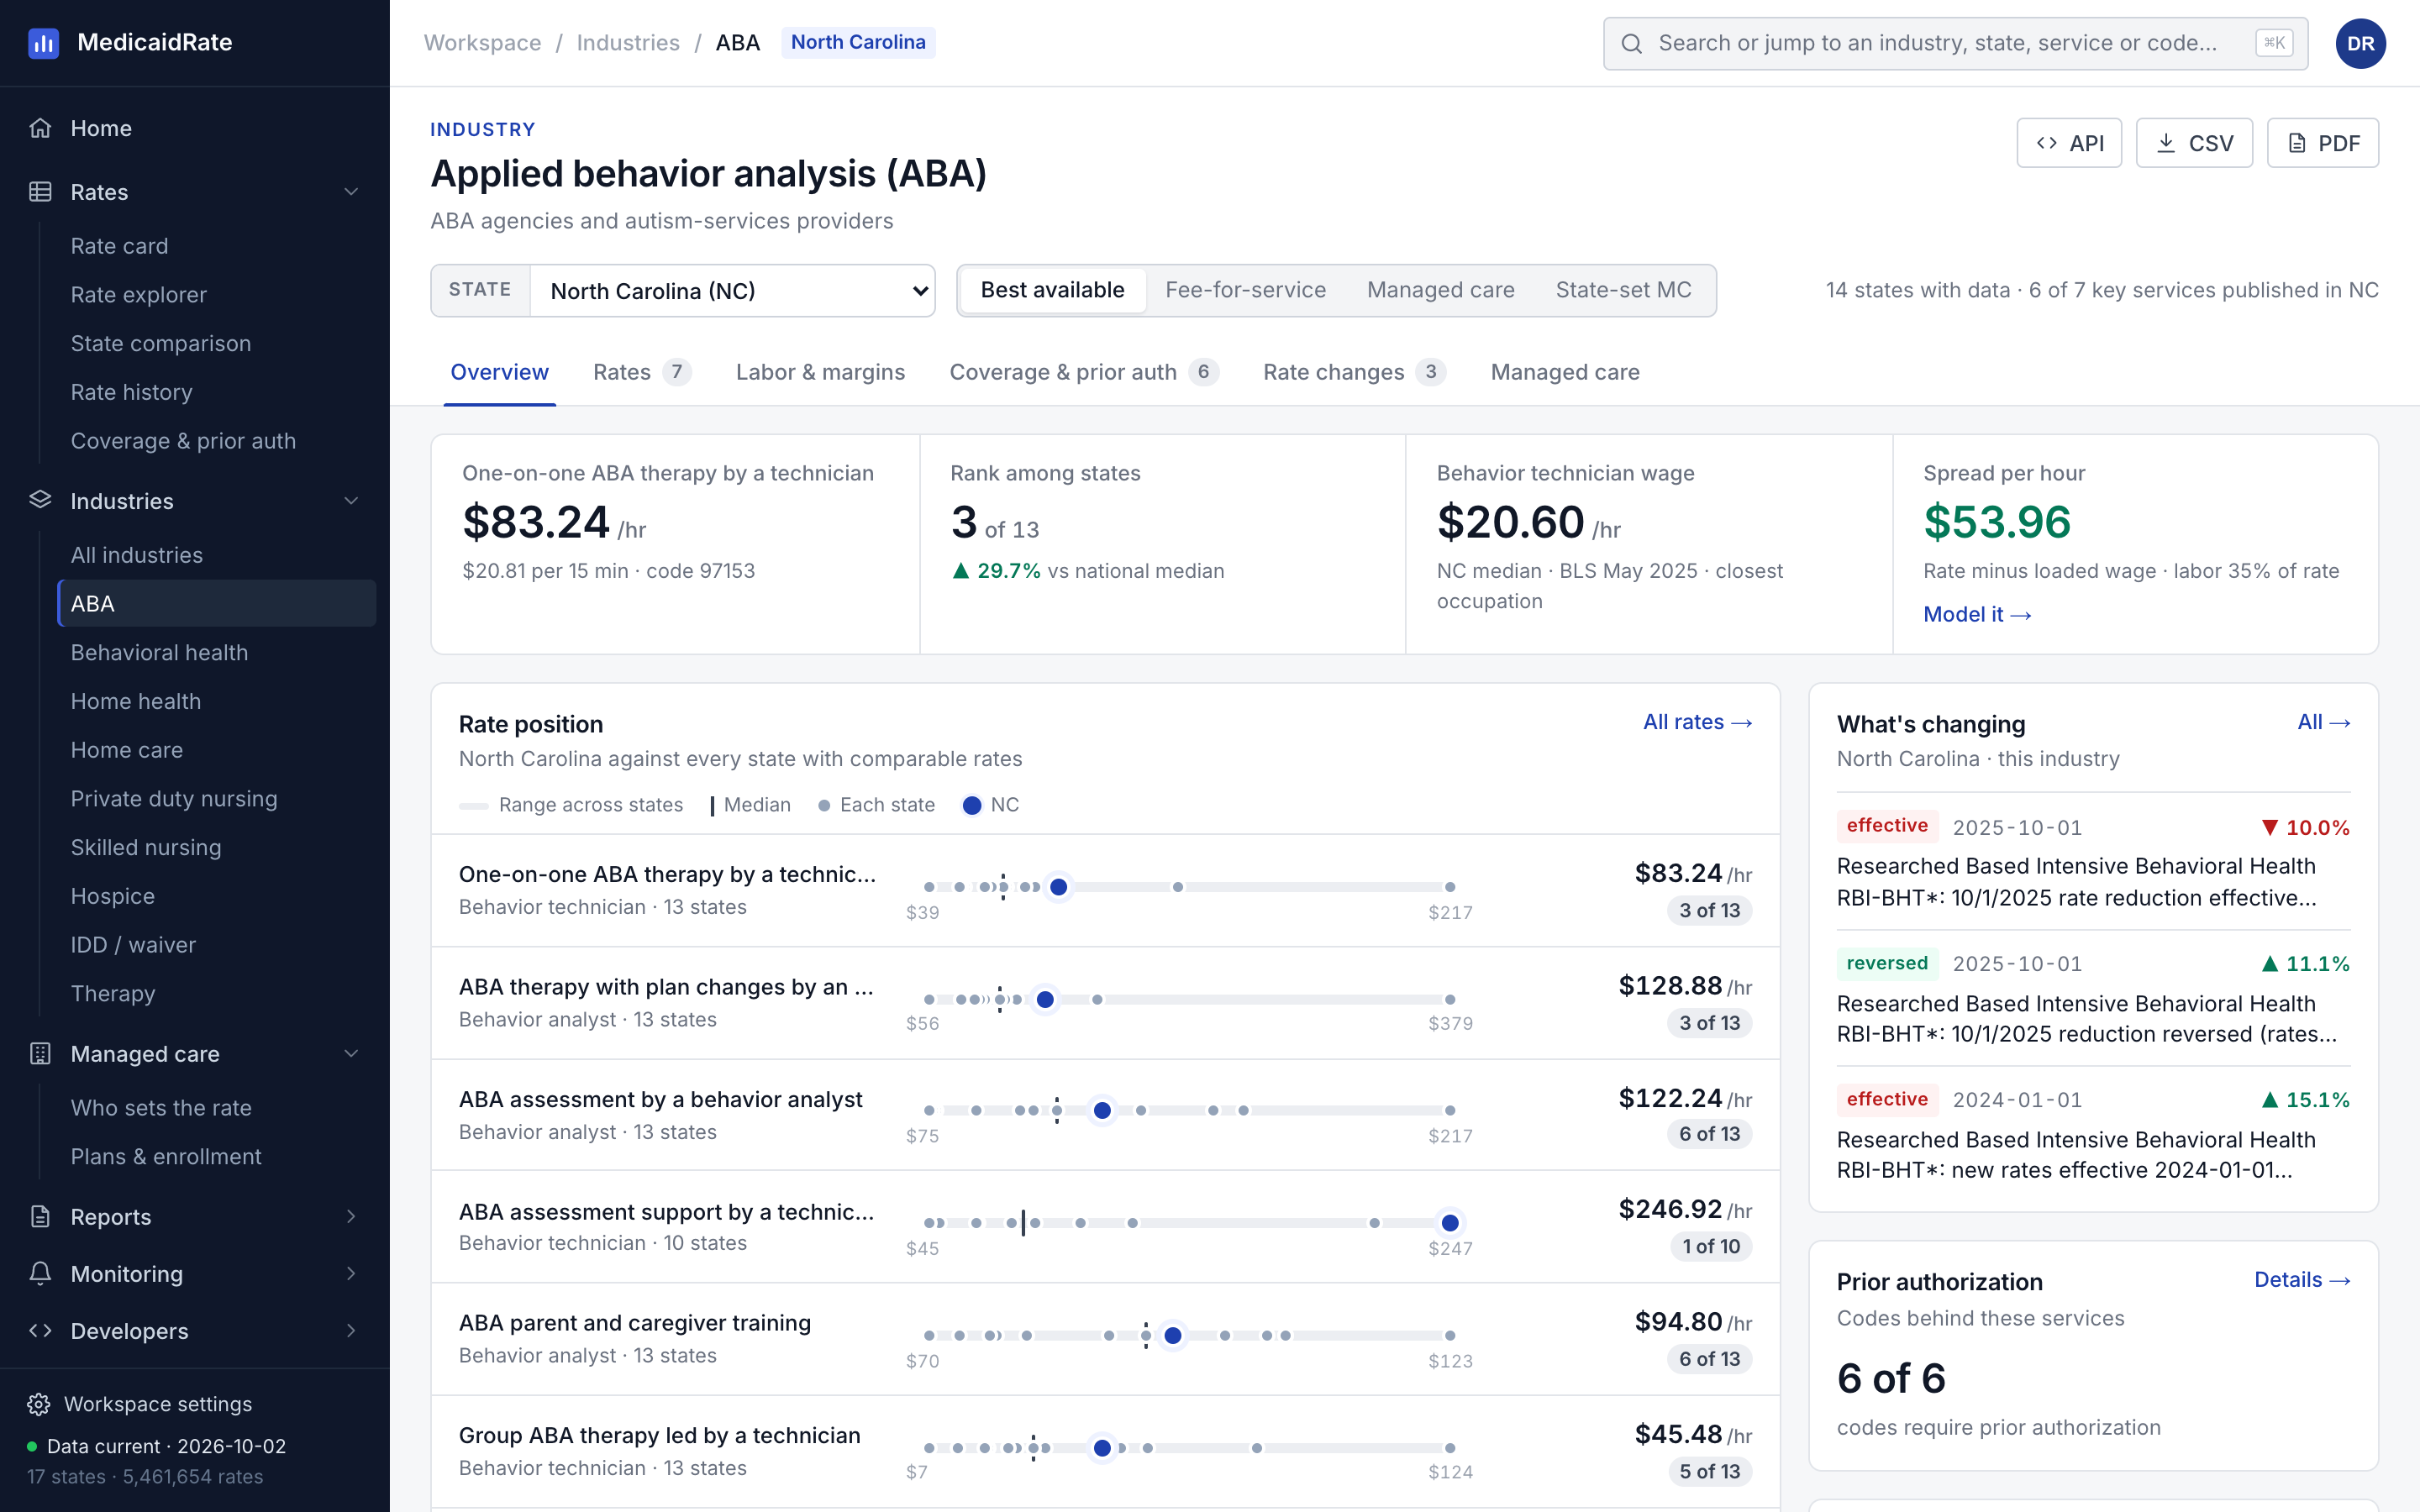
Compare states like for like, see rate history and proposed cuts, and model what a change does to revenue. Every number links to the state document it came from.
The questions
What you need answered
- Which states pay best for our service mix, net of labor costs?
- How stable have rates been, and what changes are proposed?
- How much of this market runs through managed care, and what must plans pay?
- What does a 6% cut do to monthly revenue?
Where to answer them
State comparison→
One like-for-like rate per state for any code or service, with variants and sources.
Revenue impact→
Apply a percent change, another state's schedule or a past date to a service mix.
Managed care→
By state and service line: binding plan floors, state-set rates, directed payments and capitation.